
Gold/Silver Opportunity
A - 3.4 σ event
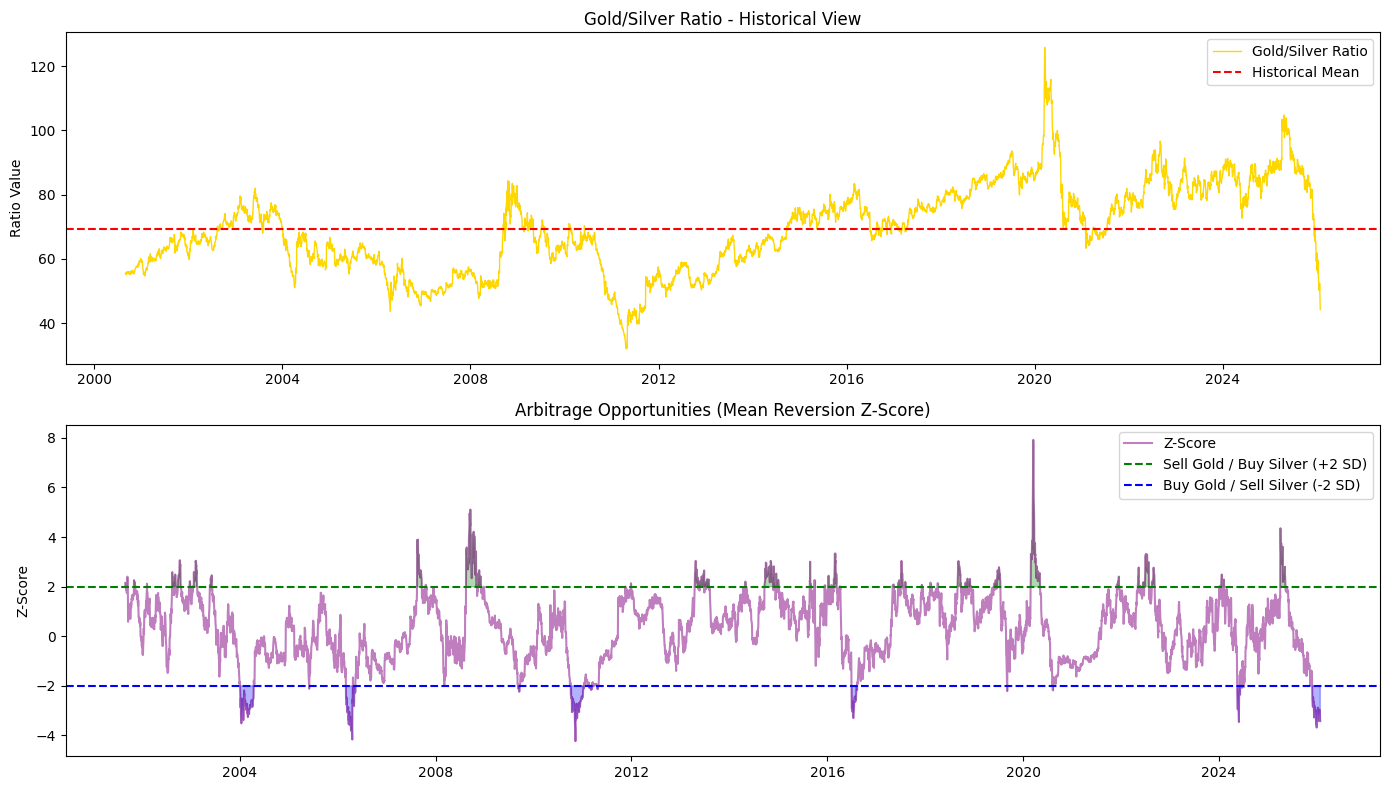
As of January 26, 2026, the market is witnessing a historic anomaly. With Silver breaching $115/oz and Gold near $5,100/oz, the Gold/Silver Ratio (GSR) has compressed to approximately 45:1.
The Z-Score of -3.4 confirms this is a statistical extreme. The last time the ratio was this compressed was during the 2011 silver squeeze. Below is the fundamental comparison of this setup against the only two other comparable periods in the last 50 years.
Source: Market Price, OA Research
Source: Market Price, OA Research
Why the Ratio Will Likely "Return to Normal" (Mean Revert)
A. The "Thrifting" Threshold
At $100/oz, silver becomes too expensive for industrial use.
Solar Panels: Manufacturers are already testing copper-based pastes to replace silver. When silver hits these price levels, engineering innovation accelerates to remove silver from the supply chain.
Result: Industrial demand typically collapses 6–12 months after a price spike, causing silver to crash while gold (which is monetary, not industrial) holds its value.
B. The "Scrap Flood"
We are likely seeing this right now. At $100/oz, the secondary market (recycling) floods the system.
People melt down family silverware, old jewelry, and pre-1964 coinage.
This massive influx of "scrap supply" alleviates the deficit that drove the price up, crushing the premium.
C. The Liquidity Trap (Recession Risk)
Silver is a "Risk On" asset; Gold is a "Risk Off" asset.
If the global economy slows down (due to high rates or energy costs), industrial demand for silver vanishes.
However, investors flee to Gold for safety.
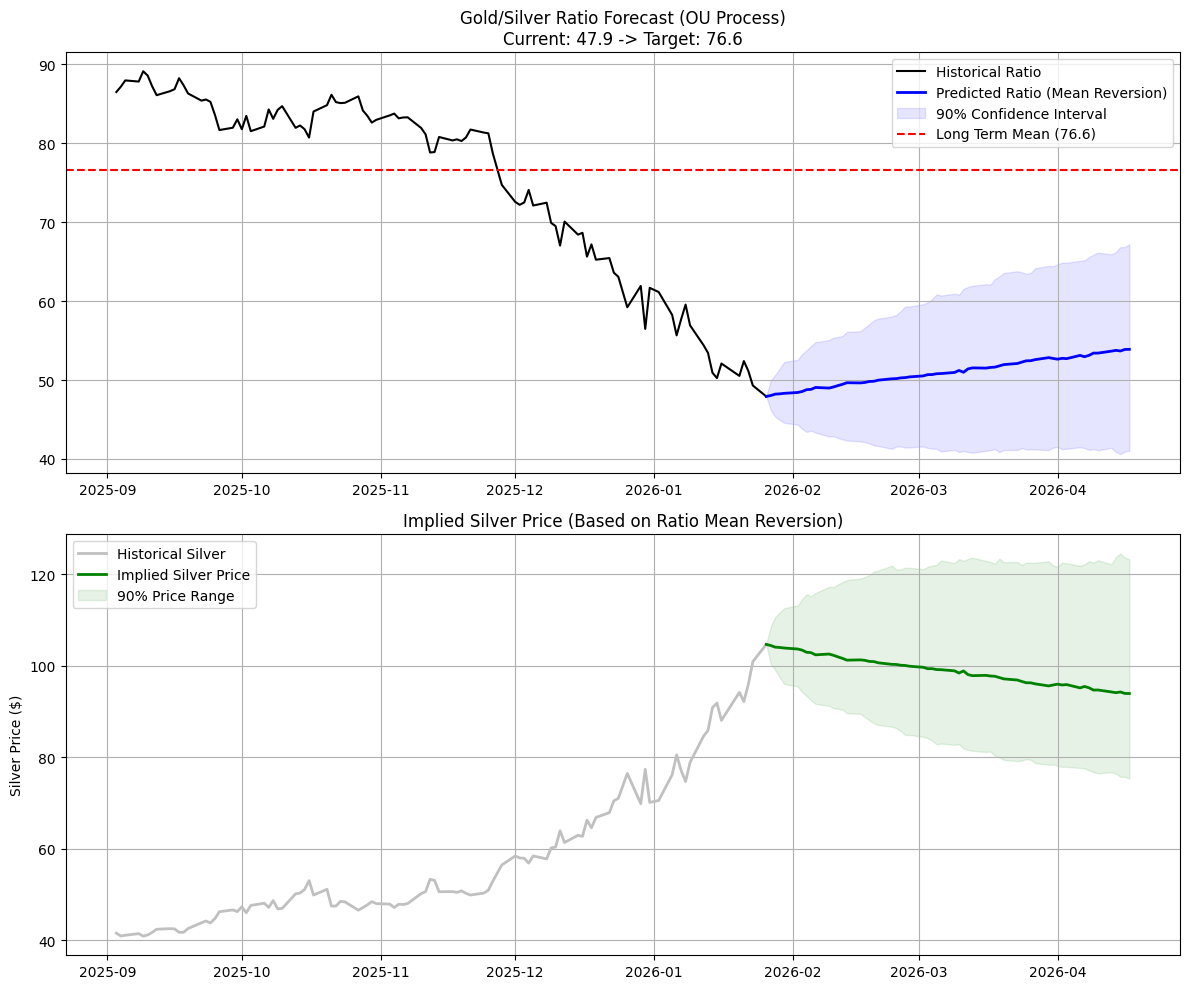
The Arbitrage: In a recession, Gold stays flat or rises, while Silver drops 20-30%. This mathematically forces the ratio back up from 48 to 70.
The Arbitrage Trade: "Long the Ratio"
Disclaimer:
For discussion purposes only. This is not investment advice or an offer/solicitation to buy or sell securities. All investments involve risk, including loss of capital. Do your own due diligence.